Java Performance
- Memory
- Performance Metrics
- Profiling
- Benchmarking
- JVM Profiling Tools
- Bibliography
Memory
Any Java object occupies at least 16 bytes, 12 out of which are occupied by a Java object header. Besides that, all Java objects are aligned by 8 bytes boundary. It means that, for example, an object containing 2 fields: int and byte will occupy not 17 (12 + 4 + 1), but 24 bytes (17 aligned by 8 bytes).
Each Object reference occupies 4 bytes if the Java heap is under 32G and XX:+UseCompressedOops is turned on (it is turned on by default in the recent Oracle JVM versions). Otherwise, Object references occupy 8 bytes.
- Memory introspection using sun.misc.Unsafe and reflection
- Overview of memory saving techniques
- Garbage Collection
Understand the implications of moving b/w 32-bit and 64-bit JVMs especially in terms of memory usage and allocation.
How Memory Leaks Happen?
Mutable static fields and collections
The most common reason for a memory leak is the wrong usage of statics. A static variable is held by its class and subsequently by its classloader. While a class can be garbage collected it will seldom happen during an applications lifetime. Very often statics are used to hold cache information or share state across threads. If this is not done diligently it is very easy to get a memory leak. Especially static mutable collections should be avoided at all costs for just that reason. A good architectural rule is not to use mutable static objects at all, most of the time there is a better alternative.
Thread Local Variables
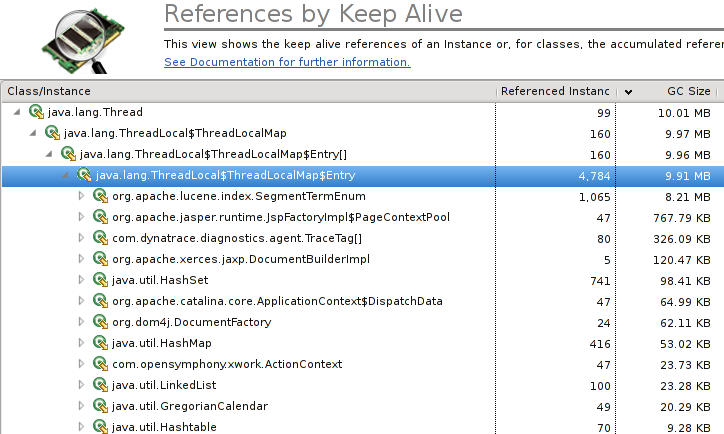
ThreadLocals are used to bind a variable or a state to a thread. Each thread has its own instance of the variable. They are very useful but also very dangerous. They are often used to track a state, like the current transaction id, but sometimes they hold a little more information. A thread local variable is referenced by its thread and as such its lifecycle is bound to it. In most application servers threads are reused via thread pools and thus are never garbage collected. If the application code is not carefully clearing the thread local variable you get a nasty memory leak. These kind of memory leaks can easily be discovered with a heap dump. Just take a look at the ThreadLocalMap in the heap dump and follow the references.
Thread Local + Static + Class Loader Leaks
A common use of ThreadLocal can introduce a very nasty classloader leak.
If you have a static ThreadLocal (e.g. using it to implement the flyweight pattern for non-threadsafe expensive objects), and the contents has a reference to the ClassLoader containing the static, the classloader will never be GC’ed.
1 2 3 4 5 6 7 8 | |
Circular and complex bi-directional references
This is my favorite memory leak. It is best explained by example:
1 2 3 4 | |
At the end of the code snippet we would think that the DOM Document will be garbage collected. That is however not the case. A DOM Node object always belongs to a Document. Even when removed from the Document the Node Object still has a reference to its owning document. As long as we keep the child object the document and all other nodes it contains will not be garbage collected.
JNI memory leaks
This is a particularly nasty form or memory leak. It is not easily found, unless you have the right tool and it is also not known to a lot of people. JNI is used to call native code from java. This native code can handle, call and also create java objects. Every java object created in a native method begins its life as a so called local reference. That means that the object is referenced until the native method returns. We could say the native method references the java object. So you don’t have a problem unless the native method runs forever. In some cases you want to keep the created object even after the native call has ended. To achieve this you can either ensure that it is referenced by some other java object or you can change the local reference into a global reference. A global reference is a GC root and will never be garbage collected until explicitly deleted by the native code. The only way to discover such a memory leak is to use a heap dump tool that explicitly shows global native references. If you have to use JNI you should rather make sure that you reference these objects normally and forgo global references altogether. You can find this sort of leak when your heap dump analysis tool explicitly marks the GC Root as a native reference, otherwise you will have a hard time.
Wrong implementation of equals/hashcode
It might not be obvious on the first glance, but if your equals/hashcode methods violate the equals contract it will lead to memory leaks when used as a key in a map. A HashMap uses the hashcode to lookup an object and verify that it found it by using the equals method. If two objects are equal they must have the same hashcode, but not the other way around. If you do not explicitly implement hashcode yourself this is not the case. The default hashcode is based on object identity. Thus using an object without a valid hashcode implementation as a key in a map, you will be able to add things but you will not find them anymore. Even worse if you re-add it, it will not overwrite the old item but really add a new one. And just like that you have memory leak. You will find it easily enough as it is growing, but the root cause will be hard to determine unless you remember this one.
The easiest way to avoid this is to use unit testcases and one of the available frameworks that tests the equals contract of your classes (e.g. http://code.google.com/p/equalsverifier/).
Classloader Leaks
When thinking about memory leaks we think mostly about normal java objects. Especially in application servers and OSGi containers there is another form of memory leak, the class loader leak. Classes are referenced by their classloader and normally they will not get garbage collected until the classloader itself is collected. That however only happens when the application gets unloaded by the application server or OSGi container.
There are two forms of Classloader Leaks that I can describe off the top of my head.
- In the first an object whose class belongs to the class loader is still referenced by a cache, a thread local or some other means. In that case the whole class loader, meaning the whole application cannot be garbage collected. This is something that happens quite a lot in OSGi containers nowadays and used to happen in JEE Application Servers frequently as well. As it is only happens when the application gets unloaded or redeployed it does not happen very often.
- The second form is nastier and was introduced by bytecode manipulation frameworks like BCEL and ASM. These frameworks allow the dynamic creation of new classes. If you follow that thought you will realize that now classes, just like objects, can be forgotten by the developer. The responsible code might create new classes for the same purpose multiple times. As the class is referenced in the current class loader you get a memory leak that will lead to an out of memory in the permanent generation. The real bad news is that most heap analyzer tools do not point out this problem either, we have to analyze it manually, the hard way. This form or memory leak became famous due to an issue in an older version of hibernate and its usage of CGLIB.
JVM Architecture
Class loader subsystem
Responsible for loading classes and interfaces
Execution engine
Responsible for the execution of the instructions specified in the classes.
Native interface
interacts with the native libraries.
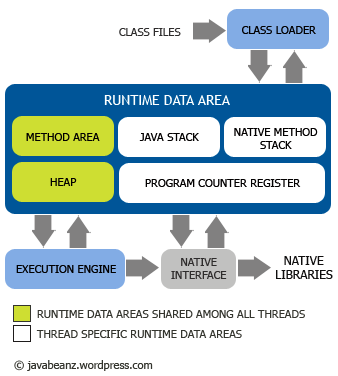
Runtime data areas
Mechanism to hold all kinds of data items such as instructions, object data, local variable data, return values & intermediate results. How runtime data are stored in the runtime data areas depends on the implementation of the JVM. Some implementation may enjoy the availability of memory and some others may not. The abstract nature of runtime data area specification allows the implementation of JVM in different machines easier. Some runtime data areas are shared among all the threads in the application, while some others are too specific to an active thread.
Runtime data areas shared among all threads
- Method area: holds the details of each class loaded by the class loader subsystem.
- Heap: holds every object being created by the threads during execution
Thread-specific runtime data areas
- Program counter register: points to the next instruction to be executed.
- Java stack: hold the state of each method (java method, not a native method) invocations for the thread such as the local variables, method arguments, return values, intermediate results. Each entry in the Java stack is called “stack frames“. Whenever a method is invoked a new stack frame is added to the stack and corresponding frame is removed when its execution is completed.
- Native method stack: holds the state of each native method call in an implementation dependent way.
Garbage Collection
- 1. Becoming a Java GC Expert - Understanding Java Garbage Collection
- 2. Becoming a Java GC Expert - How to monitor Java GC
- 3. Becoming a Java GC Expert - How to tune Java GC
- 4. Becoming a Java GC Expert - MaxClients in Apache and its effect on Tomcat during Full GC
- 5. Becoming a Java GC Expert - The Principles of Java Application Performance Tuning
- How Statement Pooling in JDBC affects the Garbage Collection
- Definition: process of looking at heap memory, identifying which objects are in use and which are not, and deleting the unused objects.
- Tuning GC
- How to tune GC
- JVM Heap size limitations - Theoretical limit for maximum heap size on 32 bit JVM is 4 GB (2^32) and for 64 bit JVM is 2^64
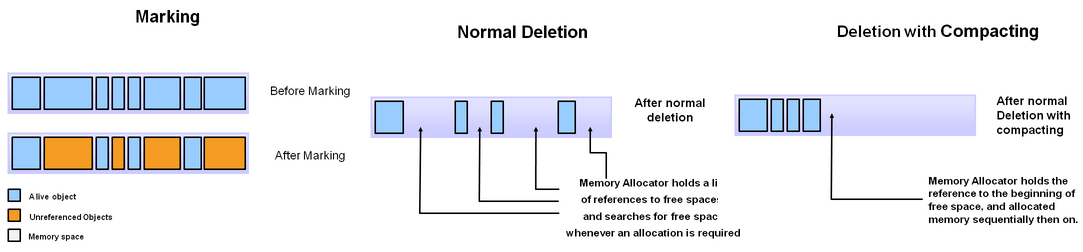
Phases
- Mark phase - garbage collector identifies which pieces of memory are in use and which are not. Unused memory is cleaned up.
- Normal deletion removes unreferenced objects leaving referenced objects and pointers to free space.
- Compact phase - To further improve performance, in addition to deleting unreferenced objects, you can also compact the remaining referenced objects. By moving referenced object together, this makes new memory allocation much easier and faster.
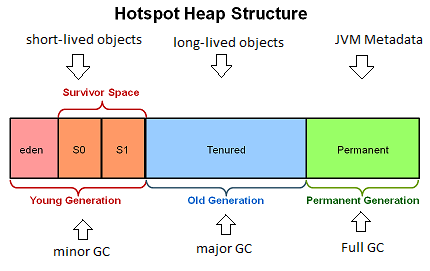
JVM Generations
- Young Generation
- all new objects are allocated and aged.
- causes a minor GC when this fills up.
- relatively quicker to collect than other generations
- All minor GCs are Stop the World events which means all the app threads are stopped until the GC completes.
- Old Generation
- stores long surviving objects.
- a threshold is set for young generation objects and when the age is met, the objects gets moved to old generation.
- causes a major GC when this fills up. Also, a Stop the World event.
- Permanent Generation
- stores metadata required by the JVM to describe the classes and methods used in the app. Java SE library classes and method may be stored here.
- class may get collected/unloaded if they are no longer needed. Causes a Full GC
Generational GC Process
- 1st minor GC
- New objects are allocated in eden space. Both survivor spaces start out empty.
- When eden space fills up, a minor GC is triggered.
- referenced objects are moved to 1st survivor space (S0)
- Eden space is cleared.
- 2nd minor GC
- When eden space fills up, a minor GC is triggered.
- referenced objects are moved to 2nd survivor space (S1).
- In addition, objects from 1st survivor space (S0) have their age incremented and get moved to S1.
- Eden & S0 space is cleared.
- 3rd minor GC
- When eden space fills up, a minor GC is triggered.
- referenced objects are moved to S0.
- In addition, objects from S1 have their age incremented and get moved to S0.
- Plus, objects that reached the threshold age are moved to old generation.
- Eden & S1 space are cleared.
- 1st major GC
- When tenure space fills up, a major GC is triggered. It cleans up and compacts that space.
Garbage Collection Algorithms
- The Serial GC
- default collector for client style machines in Java SE 5 & 6.
- Both minor & major GCs are done serially using a single virtual CPU.
- Uses a mark-compact collection method.
- Option:
-XX:+UserSerialGC. - Usages:
- For longer running apps with no low pause time requirements
- For apps which run on machine that hosts more JVMs than available processors. In such environment, GC of one app shouldn’t affect all other JVMs.
- The Parallel GC
- uses multiple threads to perform the young generation GC.
- By default, on a host with
nCPUs, the parallel GC usesnGC threads in the collection. The number of GC threads can be controlled:-XX:ParallelGCThreads=<num> - Parallel GC is also called a throughput collector.
- Usages: apps where high throughput is required and long pauses are accepted.
- 2 flavors of Parallel GC
- Option:
-XX:+UseParallelGC- does multi-threaded young generation GC, single-threaded old generation collection and compaction. - Option:
-XX:+UseParallelOldGC- does multi-threaded young, multi-thread old generation collection and compaction. (HotSpot does compaction only in the old generation)
- Option:
- The Concurrent Mark Sweep (CMS) Collector
- Also called Concurrent Low Pause Collector.
- For younger generation, uses the same algorithm as Parallel GC
- For older generation, it minimizes the pauses by doing GC concurrently with the application threads.
- Does not copy or compact the live objects. If fragmentation becomes an issue, allocate larger heap.
- Option:
-XX:+UseConcMarkSweepGC
- The G1 collector
- Also called Garbage First Collector.
- Replacement for CMS collector.
- G1 is a parallel, concurrent, and incrementally compacting low-pause collector that has a different layout from other collectors above.
- More details here
- Option:
-XX:+UserG1GC
How G1 collector works
…
Reference Types
In the order of strength, the references can be arranged as,
Strong References > Soft References > Weak References > Phantom References
SoftReference
- if free heap space is available, chances are that a soft reference will not be freed during a garbage collection cycle (so it survives from GC).
- Before throwing an OutOfMemoryError, JVM will attempt to reclaim memory by releasing instances that are softly reachable.
- Soft References ideal for implementing memory sensitive caches
Suppose that the garbage collector determines at a certain point in time that an object is softly reachable. At that time it may choose to clear atomically all soft references to that object and all soft references to any other softly-reachable objects from which that object is reachable through a chain of strong references. At the same time or at some later time it will enqueue those newly-cleared soft references that are registered with reference queues.
All soft references to softly-reachable objects are guaranteed to have been cleared before the virtual machine throws an OutOfMemoryError. Otherwise no constraints are placed upon the time at which a soft reference will be cleared or the order in which a set of such references to different objects will be cleared. VM implementations are, however, encouraged to bias against clearing recently-created or recently-used soft references.
Direct instances of this class may be used to implement simple caches; this class or derived subclasses may also be used in larger data structures to implement more sophisticated caches. As long as the referent of a soft reference is strongly reachable, that is, is actually in use, the soft reference will not be cleared. Thus a sophisticated cache can, for example, prevent its most recently used entries from being discarded by keeping strong referents to those entries, leaving the remaining entries to be discarded at the discretion of the garbage collector.
WeakReference
- Unlike Soft References, Weak References can be reclaimed by the JVM during a GC cycle, even though there’s enough free memory available.
- As long as GC does not occur, we can retrieve a strong reference out of a weak reference by calling the
ref.get()method.
Weak reference objects, which do not prevent their referents from being made finalizable, finalized, and then reclaimed. Weak references are most often used to implement canonicalizing mappings.
Suppose that the garbage collector determines at a certain point in time that an object is weakly reachable. At that time it will atomically clear all weak references to that object and all weak references to any other weakly-reachable objects from which that object is reachable through a chain of strong and soft references. At the same time it will declare all of the formerly weakly-reachable objects to be finalizable. At the same time or at some later time it will enqueue those newly-cleared weak references that are registered with reference queues.
PhantomReference
- Phantom references are the weakest form of referencing. Instances that are referred via a phantom reference cannot be accessed directly using a
get()method (it always returns null). Instead, we need to rely on Reference Queues. ReferenceQueueis the mechanism provided by the JVM to be notified when a referenced instance is about to be garbage collected. (enqueue()method in this class is package scoped. )- One use case of Phantom references is to keep track of active references within an application, and to know when those instances will be garbage collected. If we use strong references, then the instance will not be eligible for GC due to the strong reference we maintain. Instead, we could rely on a phantom reference with the support of a reference queue to handle the situation.
1 2 3 4 5 6 7 8 9 10 11 12 13 14 15 16 17 18 19 20 21 22 23 24 25 26 27 28 29 30 31 32 33 | |
Phantom reference objects, which are enqueued after the collector determines that their referents may otherwise be reclaimed. Phantom references are most often used for scheduling pre-mortem cleanup actions in a more flexible way than is possible with the Java finalization mechanism.
If the garbage collector determines at a certain point in time that the referent of a phantom reference is phantom reachable, then at that time or at some later time it will enqueue the reference.
In order to ensure that a reclaimable object remains so, the referent of a phantom reference may not be retrieved: The get method of a phantom reference always returns null.
Unlike soft and weak references, phantom references are not automatically cleared by the garbage collector as they are enqueued. An object that is reachable via phantom references will remain so until all such references are cleared or themselves become unreachable. Automatically cleared references Soft and weak references are automatically cleared by the collector before being added to the queues with which they are registered, if any. Therefore soft and weak references need not be registered with a queue in order to be useful, while phantom references do. An object that is reachable via phantom references will remain so until all such references are cleared or themselves become unreachable
Performance Metrics
- Responsiveness
- Refers to how quickly an app responds with a requested piece of data. e.g., how quickly a website returns a page.
- The focus is on responding in short period of time and long pause times are not acceptable.
- Throughput
- focus is on maximizing the amount of work done by an app in a specific period of time. e.g., no. of transactions in a given time
- The focus is on high throughput over longer periods of time and long pause times are acceptable. Quick response is not a consideration.
Profiling
- What is profiling?
- Measurement of program behavior
- Gathering of statistics about program execution
- What can profiling tell you?
- How your program is spending time
- Which methods were called? How often?
- How long did those methods take to return?
- How your program is allocating space
- Which objects were created? How many?
- How much memory are those objects using?
- How your program is spending time
- Difference between Profiling & Benchmarking
- Profiling
- Aims to identify how an application executes
- Does not accurately measure execution time
- Benchmarking
- Aims to accurately measure execution time
- Does not identify ways to improve code
- Profiling
- Types
- Sample-based: sample relevant statistics at intervals during execution
- Less overhead
- Less accuracy
- Instrumentation-based: modify application execution to generate detailed traces
- More overhead
- More accuracy
- Sample-based: sample relevant statistics at intervals during execution
Benchmarking
- Java Microbenchmarks
- http://www.ibm.com/developerworks/java/library/j-benchmark1/index.html
- Java Melody - To capture SQL calls
- Benchmarking issues
- What are you trying to test?
- Optimization requires warm-up
- Timing API accuracy
- GC latency
- The right way
- Simulate production (dataset, hardware, etc)
- Run for an extended period of time
- Warm up HotSpot™ with 10,000 iterations of benchmark code
- Calculate scores based on average execution time
- Identify outliers
- Never micro-benchmark. E.g.,
1 2 3 4 5 | |
JVM Profiling Tools
HPROF
- Command-line tool for heap and CPU profiling
- Not the most convenient or usable tool
- Process to be profiled must be started with flags
- Interface is purely text-based
- A reasonable instructional tool
- Heap and CPU profiling
- Sample- and instrumentation-based approaches
1 2 3 4 5 6 7 8 9 10 11 | |
1 2 3 4 5 6 7 8 9 10 11 | |
1 2 3 4 5 6 7 8 9 10 | |
VisualVM
- http://java.dzone.com/announcements/visualvm-12-great-java
- JVM diagnostics
- CPU and heap profiling
- JMX console (with MBeans plugin)
- Integrates a number of tools for JVM diagnostics
- jmap, jhat, jstack, jstat, and jinfo
- JConsole
- Netbeans profiler (JFluid)
- Requires Java 6
- Included with Java 6 Update 7+
- Available as a separate download for lower versions
- Runs locally or remotely (except profiler)
MAT
- Detailed heap analysis
- Memory leak identification
- Memory usage optimization
- Eclipse Memory Analyzer
- Integrated into Eclipse 3.5 Galileo
- Plugin for earlier versions of Eclipse
- Standalone RCP app
- Good performance characteristics
- Loads heap dump files incrementally
- Generated indexes
- Feature-rich (if not intuitive) user interface
- Well, it is an Eclipse application after all
- Multitude of pre-canned reports
BTrace
- Targeted, programmable profiling
- Live tracing and debugging
- Dynamic tracing tool for Java
- Declare probe points: locations at or events on which to trace
- Program trace actions to execute when a probe fires
- Key differentiators:
- Targeted nature incurs minimal performance overhead
- Programmability enables correlation of metrics to application state and method parameters
- Restricted programming model “guarantees” safety
- BTrace scripts cannot:
- Create objects or arrays
- Throw or catch exceptions
- Call arbitrary static or instance methods
- Assign to static or instance variables of the target program
- Contain synchronized blocks or methods
- Loop (for, while, or do…while)
- Assert
- Extend arbitrary classes or implement arbitrary interfaces
- Have outer, inner, nested, or local classes
Apache JMeter HP JMeter HP JTune
Tools shipped with Java
- jmap
- Prints heap memory details of a given process, core, or remote debug server
- Usage:
jmap –histo:live <pid>jmap –dump:live,format=b <pid>- TIP: prefer JMX-triggered heap dumps
- JConsole or VisualVM with MBeans plugin
- Safer than jmap
- jhat
- Parses heap dumps and launches server for heap browsing and query
- Usage:
jhat <binary heap dump file> - TIP: prefer Eclipse MAT for heap analysis
- Vastly better performance
- Vastly better usability
- jstack
- Prints stack traces of executing threads for a given process, core file, or remote debug server
- Usage:
jstack [-l] <pid> - The [-l] option (Java 6+) includes information on java.util.concurrent locks in addition to monitors
- TIP: on *nix systems, prefer
kill –QUIT(orkill –3) - Safer than jstack
- Multiple calls will quickly provide insight into execution
- jstat
- Displays performance statistics for the targeted process
- Class loader
- HotSpot™ compiler
- Garbage collector
- Usage:
jstat [output options] <pid> [interval] - TIP: a reasonable way to view individual statistics…
- …if the command line is all that’s available
- Otherwise, JConsole and VisualVM provide far more context
- jps
- Lists all java processes on the given server
- Usage:
jps [<hostname>]
- jinfo
- Prints system properties and JVM startup options for the given process, core, or remote debug server
- Usage:
jinfo <pid>
Bibliography
- Books
- Java - The Good Parts
- Inside the Java Virtual Machine - Bill Venners
- http://www.codinghorror.com/blog/2008/12/hardware-is-cheap-programmers-are-expensive.html
- http://www.infoq.com/articles/9_Fallacies_Java_Performance?utm_source=infoq&utm_medium=popular_links_homepage
- http://www.javacodegeeks.com/2012/09/visualvm-monitoring-remote-jvm-over-ssh.html
- http://www.javacodegeeks.com/resources#Profilers
- http://blog.javabenchmark.org/2013/03/write-your-own-profiler-with-jee6.html
- http://hype-free.blogspot.com/2010/01/choosing-java-profiler.html
- http://psy-lob-saw.blogspot.com/2013/04/writing-java-micro-benchmarks-with-jmh.html
- The Value and Perils of Performance Benchmarks in the Wake of TechEmpower’s Web Framework Benchmark
- Programmers Need To Learn Statistics Or I Will Kill Them All
- 5 things you didn’t know about Java Performance - Part 1, Part 2