Monitoring & Observability
- Overview
- Monitoring
- Tools
- Logging
- Tracing
- References
Monitoring is the action of observing and checking the behavior and outputs of a system and its components over time. Monitoring doesn’t fix anything. You need to fix things after they break.
Overview
Monitoring != Logging != Tracing != Instrumentation
| . | Logging | Tracing | Monitoring |
|---|---|---|---|
| Purpose | represents state transformation or events within an app. When things go wrong, logs are helpful to identify what event caused the error. | represents a single user’s journey through an entire stack of an application. Often used for optimization purposes. | Instrumenting an application and monitoring the results represents the use of a system. Often used for diagnostic purposes. Monitor apps to detect problems and anomalies. Basic fitness tests like the app is up or down, and more proactive health checks. Provides insights into capacity requirements. |
| Pros and Cons | Obtaining, transferring, storing and parsing logs is expensive. Log only important and actionable information. | Tracing libraries are often more complicated than the code they are serving. So tracing tends to be expensive | Instrumentation is often cheap to compute. Metrics take nanoseconds to update and some monitoring systems operate on a “pull” model, which means that the service is not affected by monitoring load. |
| Tools and Frameworks | depends on the technology. e.g, logback, log4j, etc. Splunk | OpenTracing | Prometheus, DynaTrace, Wily |
Monitoring
- Metric identity name: k-tuple
- Metrics values
- counters, gauges, percentiles, nominal, ordinal, interval, ratio, derived
- How can we monitor?
- Resolution: how frequent to collect the metrics? every 6-10secs?
- Latency: how long before we act on them?
- Diversity: are we collecting different metrics?
-
What is write-ahead logging? Used in HBase.
- Any monitoring system should answer 2 main questions:
- What’s broken?
- and why?
Types
- Black-box monitoring
- Testing externally visible behavior as a user would see it. e.g., Dynatrace Gomez
- It is symptom-oriented and represents active - not predicted problems. e.g., “The system isn’t working right now.”
- Useful for paging. It has the key benefit of forcing discipline to only nag a human when a problem is both already ongoing and contributing to real symptoms.
- White-box monitoring
- Monitoring based on metrics exposed by the internals of the system, including logs, interfaces like JVM profiling interface, or an HTTP handler that emits internal statistics. e.g.
/healthendpoint pattern. - It depends on the ability to inspect the innards of the system, such as logs or HTTP endpoints, with instrumentation.
- It allows detection of imminent problems, failures masked by retires, and so forth.
- Telemetry from white-box monitoring is essential for debugging. e.g., if web requests are slow, you need to know whether the slowness is caused by a network problem or slowness in database.
- Monitoring based on metrics exposed by the internals of the system, including logs, interfaces like JVM profiling interface, or an HTTP handler that emits internal statistics. e.g.
Why Monitor?
- Analyzing long-term trends
- How big is my database and how fast is it growing? How quickly is my daily-active user count growing?
- Comparing over time or experiment groups
- Are queries faster with Acme Bucket of Bytes 2.72 versus Ajax DB 3.14? How much better is my memcache hit rate with an extra node? Is my site slower than it was last week?
- Alerting
- Building dashboards
- Conducting ad hoc retrospective analysis (i.e., debugging)
- Our latency just shot up; what else happened around the same time?
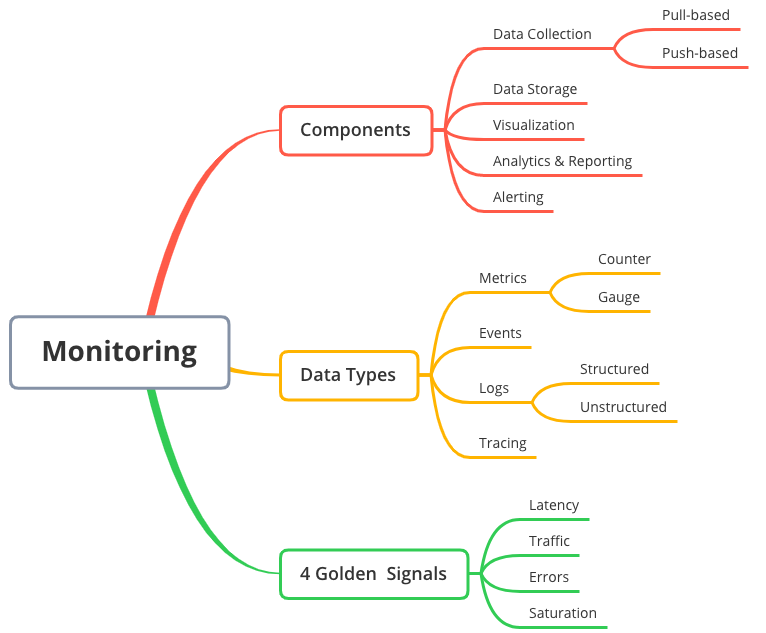
4 Golden Signals
The 4 golden signals of monitoring are: S.E.L.T. (saturation, error, latency, traffic)
- Latency
- The time it takes to service a request.
- It’s important to distinguish between the latency of successful requests and the latency of failed requests.
- For example, an HTTP 500 error triggered due to loss of connection to a database or other critical backend might be served very quickly; however, as an HTTP 500 error indicates a failed request, factoring 500s into your overall latency might result in misleading calculations. On the other hand, a slow error is even worse than a fast error!
- Traffic
- A measure of how much demand is being placed on your system, measured in a high-level system-specific metric.
- For a web service, this measurement is usually HTTP requests per second, perhaps broken out by the nature of the requests (e.g., static versus dynamic content).
- For an audio streaming system, this measurement might focus on network I/O rate or concurrent sessions.
- For a key-value storage system, this measurement might be transactions and retrievals per second.
- Errors
- The rate of requests that fail,
- either explicitly (e.g., HTTP 500s),
- implicitly (for example, an HTTP 200 success response, but coupled with the wrong content),
- or by policy (for example, “If you committed to one-second response times, any request over one second is an error”).
- Where protocol response codes are insufficient to express all failure conditions, secondary (internal) protocols may be necessary to track partial failure modes.
- Monitoring these cases can be drastically different: catching HTTP 500s at your load balancer can do a decent job of catching all completely failed requests, while only end-to-end system tests can detect that you’re serving the wrong content.
- The rate of requests that fail,
- Saturation
- How “full” your service is.
- A measure of your system fraction, emphasizing the resources that are most constrained (e.g., in a memory-constrained system, show memory; in an I/O- constrained system, show I/O).
- Note that many systems degrade in performance before they achieve 100% utilization, so having a utilization target is essential.
- Latency increases are often a leading indicator of saturation.
- Saturation is also concerned with predications of impending saturation, such as “it looks like your DB will fill its hard drive in 4 hours”
Anti-patterns
- Tool Obsession
- there is no such things as the single-pane-of-glass tool that will suddenly provide you with perfect visibility into your network, servers, and applications, all with little to no tuning or investment of staff. Many monitoring software vendors sell this idea, but it’s a myth.
- Monitoring isn’t a single problem, so it stands to reason that it can’t be solved with a single tool either.
- Agentless monitoring is extraordinarily inflexible and will never give you the amount of control and visibility you desire.
- How many tools is too many? - If there are 3 tools to monitor your DB and they all provide the same information, you should consider consolidating. On the other hand, if all three provide different information, you’re probably fine.
- Avoid Cargo-culting tools - Adopting tools and procedures of more successful teams and companies in the misguided notion that the tools and procedures are what made those teams successful, so they will also make your own team successful in the same ways. Sadly, the cause and effect are backward: the success that team experienced led them to create the tools and procedures, not the other way around.
- Monitoring-as-a-Job
- Strive to make monitoring a first-class citizen when it comes to building and managing services. Remember, it’s not ready for production until it’s monitored.
- Observability team is the team whose job is to build self-service monitoring tools as a service to another team. However, this team is not responsible for instrumenting the apps, creating alerts, etc. The anti-pattern is to caution against having your company shirk the responsibility of monitoring at all by resting it solely on the shoulders of a single person.
- Checkbox Monitoring
- This antipattern is when you have monitoring systems for the sole sake of saying you have them. This is ineffective, noisy, untrustworthy, and probably worse than having no monitoring at all.
- Common signs of this antipattern
- recording metrics like CPU usage, system load, and memory utilization, but the service still goes down.
- find yourself consistently ignoring alerts, as they are falst alarms more often than not.
- checking systems for metrics every 5 mins.
- not storing historical metric data.
- Fix
- OS metrics aren’t very useful for alerting. If CPU usage is above 90% that is no reason to alert, if the server is still doing what it’s supposed to do.
- Collect your metrics more often and look for patterns.
- Alerting as a Crutch
- Avoid the tendency to learn on monitoring as a crutch. Monitoring is great for alerting problems, but don’t forget the next step: fixing the problems.
Design Patterns
- 1) Composable Monitoring: Use multiple specialized tools and couple them loosely together, forming a monitoring platform. Similar to the UNIX philosophy, Write a program that do one thing and do it well. Write programs to work together.
-
2) Monitor from the user perspective: One of the most effective things to monitor is simply HTTP response codes (especially of the HTTP 5xx variety) followed by request times (aka latency). Always ask yourself, “How will these metrics show me the user impact?”.
- When measuring the performance of your request, don’t just calculate the average response time. Bucket them by latencies: how many requests took between 0 ms and 10ms, between 10 ms and 30 ms, , between 30 ms and 100 ms, and so on. Plotting this in a histogram is often an easy way to visualize the distribution of your requests.
Telemetry Data
- M.E.L.T. (Metrics, Events, Logs and Traces)
-
M.E.L.T. are the essential data types of observability.
- Events
- An event is a discrete action happening at a moment in time. Events are just about “something happened at some time.”
- Example: At 3:34pm on 2/21/2019 a bag of BBQ chips was purchased for 1 dollar.
- There’s no hard and fast rule about what data an event can contain—you define an event as you see fit. Events become more powerful when you add more metadata to them. e.g., Event type, ItemCategory and PaymentType, etc.
- Since events are basically a history of every individual thing that happened in your system, you can roll them up into aggregates to answer more advanced questions on the fly.
- Pros
- Include individual data points
- allow you to ask whatever questions you want at any point
- can be computed on the fly
- Cons
- Every event takes some amount of computational energy to collect and process. They also take up space in your database—potentially lots of space. For example, you could store an event for every minuscule, sub-degree shift in temperature, which would quickly fill up even the largest databases. Or you could instead take a sample of the temperature at a regular interval. This kind of data is better stored as a metric.
- Expensive to store high volumes of event data
- May hit bandwidth constraints within the source system while collecting and sending the event data
- Can be time-consuming to query
- Metrics
- Metrics are an aggregated set of measurements grouped or collected at regular intervals.
- Unlike events, metrics are not discrete — they represent aggregates of data over a given time span.
- Types of metric aggregation are diverse (e.g., average, total, minimum, maximum, sum-of-squares) but all metrics generally share the following traits:
- A timestamp (note that this timestamp represents a timespan, not a specific time)
- A name
- One or more numeric values representing some specific aggregated value
- A count of how many events are represented in the aggregate
- Example: For the minute of 3:34-3:35pm on 2/21/2019 there was a total of three purchases totaling $2.75.
- Notice, we’ve lost some data here compared to an event. We no longer know what the specific three purchases were, nor do we have access to their individual values (and this data cannot be recovered). However, this data requires significantly less storage but still allows us to ask certain critical questions like, “What were my total sales during any given minute?”
- Example metrics: error rate, response time, throughput, etc.
- Metrics come in different representations
- Counter is an ever-increasing metric. e.g., Odometer in a car, number of visits to a site.
- Gauge is a point-in-time value. e.g., Speedometer n a car.
- The nature of gauge has one big shortcoming: it doesn’t tell anything about previous values and provides no hint of future values. Storing gauges in a TSDB can do such things as plot on a graph, predict future trends, etc.
- Pros
- Store significantly less data
- Less time to compute roll-ups
- Cons
- Required to make decisions ahead of time on which you want to analyze the data
- Logs
- Logs are essentially strings of text with a timestamp associated with them.
- Like events, log data is discrete
- Logs come in 2 types
- Unstructured Logs
- Structured Logs: most common example is JSON format.
- One can event produce multiple logs. e.g., one customer purchase event in a vending machine could potentially have multiple log messages like coin inserted, buttons pressed, dispensed, etc.
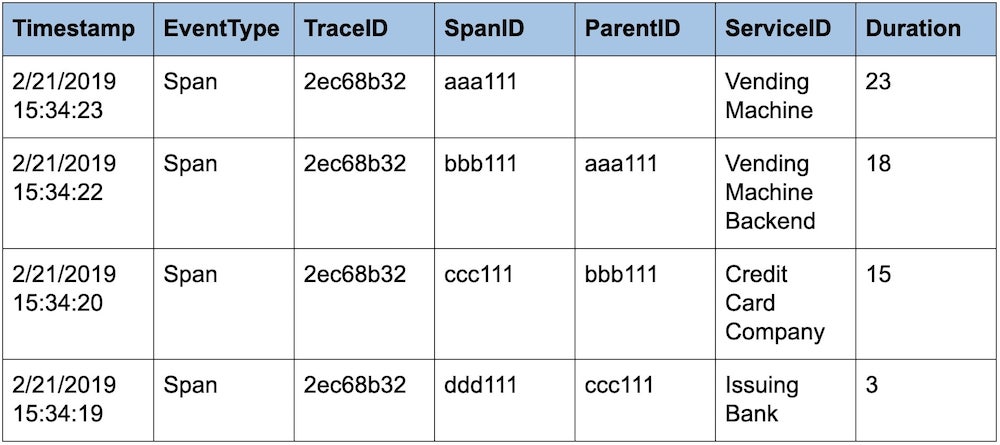
- Traces
- Traces—or more precisely, “distributed traces”—are samples of causal chains of events (or transactions) between different components in a microservices ecosystem. And like events and logs, traces are discrete and irregular in occurrence.
- Traces stitched together form special events called “spans”; spans help you track a causal chain through a microservices ecosystem for a single transaction. To accomplish this, each service passes correlation identifiers, known as “trace context,” to each other; this trace context is used to add attributes on the span.
Components
https://www.usenix.org/sites/default/files/conference/protected-files/dickson.pdf
A monitoring service has 5 primary facets
1) Data collection
- Pull-based
- SNMP, Nagios.
- use of
/healthendpoint pattern in app monitoring which exposes metrics and health information about an app which can be polled by a monitoring service, service discovery tool like Consul and etcd or by a load balancer. - Pull model can be difficult to scale, as it requires central systems to keep track of all known clients, handle scheduling, and parse returning data.
- Push-based
- Push model is easier to scale in a distributed architecture such as cloud, due to the lack of a central poller. Nodes pushing data need to only know where to send it, and don’t need to worry about underlying implementation of the receiving end.
- various systems gather data at various speeds.
- various systems have various concepts of a unit of a metric identity
- no consistent interface
- e.g.,
top,np,netstats,sar,nagios.
2) Data storage
- Metrics Storage
- Metrics, being time series, as usually stored in a Time Series Database (TSDB). e.g., Round Robin Database (RRD), Graphite’s Whisper, OpenTSDB.
- Many TSDBs roll up or age out data after a certain time period. This means that as the data gets older, multiple datapoints are summarized into a single datapoint. A common roll up method is averaging, though some tools support other methods such as summing datapoints.
- Metric rollup occurs as a result of compromises: storing native resolution of metrics gets very expensive for disks - both in storage and in the time it takes to read all those datapoints from disk for use in a graph.
- Log Storage
- 2 flavors
- Store the log data as flat files. e.g.,
rsyslog - Store the log files in a search engine. e.g., ElasticSearch
- Store the log data as flat files. e.g.,
- Metric storage is inexpensive. Log storage can get expensive.
- 2 flavors
3) Visualization
Edward Tufte’s The Visual Display of Quantitive Information and Stephen Few’s Information Dashboard Design.
- A driving principle behind great monitoring is that you should be building things in a way that works best for your environment.
- Common visualization for time series data is the line graph (also called a strip data).
- Visualization should be actionable items. Avoid pie charts for disk usage metrics. Think of visual graphs which can predict the disk size after 6 months.
- Flame graphs
- State maps
4) Analytics and reporting
SLA, SLO, SLI
The SLA, SLO, and SLI are based on the assumption that the service will not be available 100%
- SLA (Service Level Agreement)
- is a contract that the service provider promises customers on service availability, performance, etc.
- SLAs are for external
- SLA is simply an SLO that 2 or more parties have “agreed”.
- SLAs make sense only when considered in fixed timeframes, which are called “assurance windows”.
- SLO (Service Level Objective)
- is a goal that service provider wants to reach.
- SLOs are generally used for internal only.
- If a service availability violates the SLO, operations need to react quicly to avoid it breaking the SLA which would cost money to the service provider.
- SLOs are alerting rules
- SLI (Service Level Indicator)
- is a measurement the service provider uses for the goal.
- SLIs are the metrics in the monitoring system
Most people really mean SLO when they say “SLA”. One giveaway: if somebody talks about an “SLA violation”, they are almost always talking about a missed SLO. A real SLA violation might trigger a court case for breach of contract.
- Relationship
- The service provider needs to collect metrics based on SLI,
- define thresholds of metrics based on SLO, and
- monitor the thresholds of metrics so that it won’t break SLA.
You can’t meet or exceed expectations if no one agrees what the expectations are.
Availability
- Availability of an application/service is commonly referred to by the number of nines. 99.99% is four nines.
Availability = uptime / (downtime + uptime)- Most common ways to measure availability are the marking of time quanta or counting failures.
- Why High Availability is difficult?
- According to Nyquist-Shannon sampling theorem, to measure an outage of 2 minutes, you must be collecting data in minute-long intervals. Thus, to measure availability down to 1 second, you must be collecting data at sub-second intervals. This is just one reason why achieving accurate SLA reporting better than 99% is so difficult.
- An oft-overlooked point about availability is when your app has dependent components: your service can ony be as available as the underlying components on which it is built. e.g, AWS S3 provides 99.95% SLA. An app depending on S3 can never be >99.95% SLA.
- Similarly, if the underlying network is unreliable, the servers and application higher in the stack can’t possibly be more reliable than the network.
- Each additional nine of availability has significantly more cost associated with it, and the investment often isn’t worth it: many customers can’t tell the difference between 99% and 99.9%.
5) Alerting
- Monitoring doesn’t exist to generate alerts: alerts are just one possible outcome. With this in mind, remember that every metric you collect and graph does not need to have a corresponding alert.
- An alert should evoke a sense of urgency and require action from the person receiving that alert. Everything else can essentially be a log entry, a message dropped in your internal chat room, or an auto-generated ticket.
- 3 alert categories
- Response/action required immediately - send these to SMS, PagerDuty
- Awareness needed, but immediate action not required - send these to internal chat rooms
- Record for historical/diagnostic purposes - send it to log file and analyze later
6 alerting best practices
- Stop using email for alerts
- Write runbooks - A runbook is for when human judgement and diagnosis is necessary to resolve something.
- Arbitrary static thresholds aren’t the only way
- Alerting on things like “datapoint has crossed X” isn’t useful. A static threshold set to alert at “free space under 10%” isn’t going to alert when a disk quickly growing in usage from 11% to 80% overnight.
- Using a percent change/derivative would handle our disk usage problem by reporting us “disk usage has grown by 50% overnight”
- Few such approaches: moving averages, confidence bands, standard deviation
- Delete and tune alerts
- Alert fatigue occurs when you are so exposed to alerts that you become desensitized to them. Alerts should cause a small adrenaline rush.
- Use maintenance periods
- If you need to do work on a service or app, and you expect it to trigger an alert (e.g., due to it being down), then set that alert into maintenance period.
- Attempt self-healing first
On-Call
Effective strategies for On-Call
- Make it the duty of on-call to work on systems resiliency and stability during their on-call shift when they aren’t fighing fires.
- Explicitly plan for systems resiliency and stability work during the following week’s sprint planning/team meeting, based on the information collected from the previous on-call week.
- Start the on-call rotation during the workweek instead of calendar week. This allows the team to do an on-call handoff.
- Follow-The-Sun (FTS) Rotations allow to have full on-call coverage with no one being on-call during nights. One big downside to FTS rotations is the significant increase in communication overhead.
- Only when you have a large team, have a backup on-call person to the primary on-call person. For smaller teams, this means the same person being on-call every 2-3 weeks.
- How many people do you need for an effective on-call rotation schedule? It depends on 2 factors: how busy your on-call tends to be and how much time you want to give people between on-call shifts.
- Software engineers should be on-call. Avoid the “throw-it-over-the-wall version of software engineering. If software engineers are aware of the struggles that come up during the on-call, then they are incentivized to build better software.
Tools: PagerDuty, VictorOps, OpsGenie
PagerDuty’s Incident Response Documentation https://response.pagerduty.com/
Monitoring at various tiers
Business Monitoring
TBD
Frontend Monitoring
- 2 approaches for frontend monitoring
- RUM (real use monitoring)
- uses actual user traffic for the monitoring data
- e.g., Google Analytics
- Synthetic monitoring
- create fake requests under a variety of test conditions to generate the data
- e.g., WebpageTest.org, Dynatrace Gomez scripts
- RUM (real use monitoring)
- DOM (Document Object Model)
- Synchronous loading: By default, scripts in a webpage are loaded synchronously. i.e., if the DOM parsing encounters a
<script>tag, then the browser will stop parsing the DOM and load the script. - Asynchronous loading: HTML5 supports
asyncattribute on<script>tags which allows the scripts to be downloaded in background while the DOM continues to be loaded, executing the script when it’s finished downloading. This improves the page performance greatly.
- Synchronous loading: By default, scripts in a webpage are loaded synchronously. i.e., if the DOM parsing encounters a
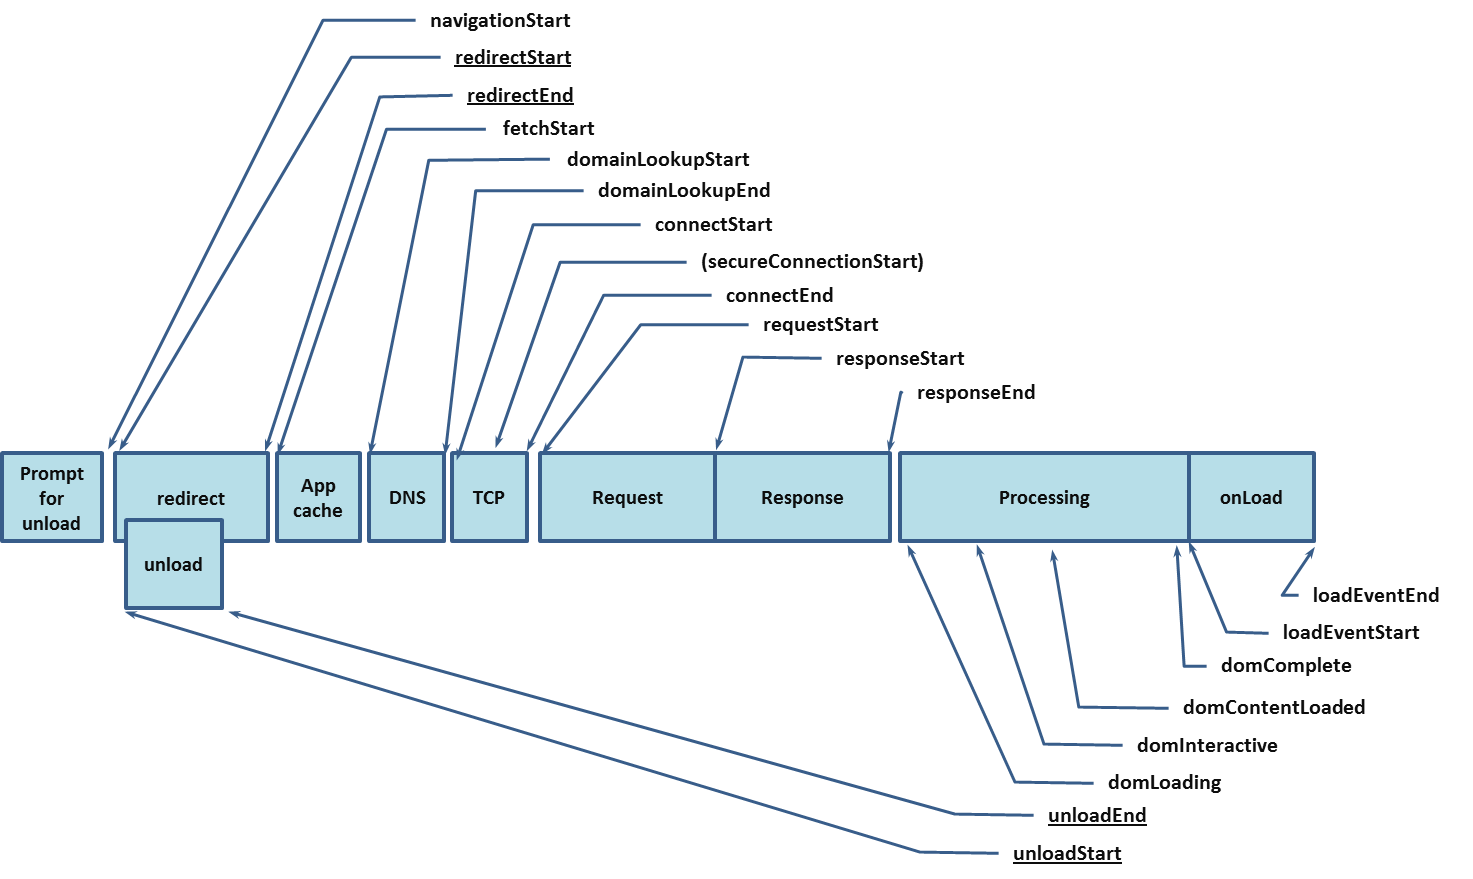
- Performance Metrics
- Navigation Timing API
- Browsers expose page performance metrics via Navigation Timing API.
- This API exposes 21 metrics. Consistently useful among them are
navigationStart,domLoading,domInteractive,domContentLoaded,domComplete
- User Timing API
- While Navigation Timing API’s metrics are browser set, User Timing API allows you to create your metrics and events.
- Navigation Timing API
- Tools
- WebPageTest.org
- SpeedIndex
- calculates the user-perceived completeness
- Whereas Navigation Timing metrics ruly on accurate reporting by the browser, Speed Index uses video capture at a rate of 10 frames per second to determine exactlly when a page is finised loading from a visual perspective.
- Speed Index Algorithm produces a single number as output - lower is better.
Application Monitoring
- StatsD
- tool created by Etsy in 2011 to add metrics inside of your code - originally designed for a Graphite backend
- A network daemon that runs on the Node.js platform and listens for statistics, like counters and timers, sent over UDP or TCP and sends aggregates to one or more pluggable backend services (e.g., Graphite, OpenTSDB, InfluxDB)
- Monitor CI/CD pipeline
- capture metrics like deployment start time, end time, etc.
- Deployment metrics along with application performance metrics together can help identify issues caused by a particular deployment.
- Health Endpoint Pattern
/healthendpoint pattern or canary endpoint or status endpoint is an HTTP endpoint to provide basic health metrics about the app - e.g., app version, configuration used, status of dependencies, etc.- Benefits
- can be used as the health check for a load balancer or for service discovery tools
- helpful for debugging: exposing build information helps with determining what is running in the environment easily
- Downsides
- involves a lot more engineering work to implement than a simple push-based metrics approach
- need tooling to consistently check the endpoint
- Monitoring Serverless Apps
- TBD
Server Monitoring
- CPU usage:
/proc/statmetrics viatopcommand - Memory usage:
/proc/meminfometrics viafree -mcommand- also monitor the OOMKiller spawning in the logs
- Network usage:
/proc/net/devmetrics viaifconfig,ip(from theiproute2package) - Disk usage:
/proc/diskstatsmetrics viaiostat -x(from thesysstatpackage)- iowait represents the amount of time the CPU was idle due to waiting on the disk to complete operations.
iostatwithout-xreturns tps (transfers per second) or IOPS (I/O per second). Noticing a sudden drop in IOPS may indicate a disk performance problem.
- Load:
/proc/loadavgmetrics viauptimecommand.- Load is a measurement of how many processes are waiting to be served by the CPI. It’s represented by 3 numbers: a 1 m average, a 5 m average, a 15 m average (Brendan Gregg’s article to learn more)
- SSL Certificates
- For external site monitoring, use tools like Pingdom, StatusCake, etc.
- For internal site monitoring, create custom shell scripts.
- Web Servers
- Requests per second (req/sec):Golden metric for assessing web server performance or throughput.
- open connections or keepalives
- connections are not requests. Prior to the use of keepalives, each request required its own connection. Since a web page may have multiple objects to request for the page to load, this led to a whole lot of connections.
- Opening a connection requires going through the full TCP handshake, setting up a connection, moving data, and tearing down the connection - dozens of times for a single page.
- Thus, HTTP keepalives were born: the web server holds open the connection for a client rather than tearing it down, to reuse the connection for the client which allows many requests to be made over a single connection. Of course, the connection can’t be held open forever, so keepalives are governed by a timeout on the webserver side.
- There is also a keepalive configuration on the browser side called persistent connection with their own timeout values. All modern browsers use persistent connections by default.
- request time
- Database Servers
- open connections
- queries per second
- IOPS
- Caching
- # of evicted items: high evictions are a good signal for a cache being too small, causing too many items to be evicted in order to make room for new items.
- Hit/miss ratio or cache-hit ratio
- NTP server
ntpstat
Network Monitoring
TBD
Security Monitoring
- HIDS (Host Intrusion Detection System)
- detects bad actors or rootkits on a particular host
- Rootkits can be anything from mass-installed webshells to stealthy recompiled binaries and everything in-between.
- Due to their stealthy nature, rootkits can be rather difficult to detect.
- Tools: rkhunter, OSSEC.
- NIDS (Network Intrusion Detection System)
- detects threats on the network itself.
- works by listening in on the raw traffic on the wire using one or more network taps placed throughout the network.
- A Network tap is a piece of hardware that sits inline on your network, intercepting all traffic that passes through it and forwarding a copy to another system.
- The networks tap traffic are sent for analysis into a tool called security information and event management (SIEM). e.g., Zeek, Snort.
Tools
- AppDynamics
- Cacti (mrtg++) - Network Graphing solution designed to harness the power of RRDTool’s storage and graph functionality
- Consul
- ElasticSearch
- etcd
- FluentD - an open-source tool to collect events and logs and store as JSON - built on CRuby - plugins enables to store the massive data for Log Search (like ElasticSearch), Analytics and Archiving (MongoDB, S3, Hadoop)
- Ganglia - a scalable distributed system monitor tool for high performance computing systems such as clusters and grids. - typically used with Nagios.
- Grafana - Visualization tool
- Graphite
- this open-source tool written on Python does 2 things: store numeric time-series data and render graphs of this data on demand
- does not collect data.
- 3 components
- GrayLog2 - an open source data analytics system - search logs, create charts, create alerts - leverages Java and ElasticSearch. Communication via REST API
- LogStash - Redis for storage - RabbitMQ, grok - Typical implementation: logstash + redis + elasticsearch
- InfluxDB
- Jaeger - open-source distributed tracing system
- Kibana - web interface for viewing logstash records stored in elasticsearch
- Librato - Commercial tool
- Loggly - Commercial tool
- MRTG - acronym for Multi Router Traffic Grapher - free software for monitoring and measuring the traffic load on network links. - gets its data via SNMP agents every few minutes - results are plotted in graphs - has alerting mechanism
- Nagios
- NewRelic
- OpenTSDB - pure storage solution - a free distributed time-series database written on top of HBase - was written to store, index and serve metrics collected at a large scale, and make it easily accessible and graphable.
- Pingdom - Commercial tool
- Prometheus
- RRDTool - acronym for Round-Robin Database Tool - aims to handle time-series data like n/w bandwidth, CPU load, etc. - The data are stored in a round-robin circular buffer/database, thus the system storage footprint remains constant over time. - It has tools to display the data in graphical format.
- sar
- Sensu - open source monitoring framework
- Shinken
- open-source Nagios like tool, redesigned and rewritten from scratch.
- Nagios + Graphite + Configuration
- Smashing - Visualization tool
- Splunk
- Statsd
- listens to anything and everything
- written in node.js. There are alternative implementations in groovy, C, etc.
- listens to statistics (counters and timers) and sends aggregates to backend services like Graphite
- trace
- Zenoss
- Zipkin
- Shippers
- lumberjack
- beaver
- syslog
- woodchuck
- Other tools
- monigusto
- collectd
- jmxtrans
- tasseo
- gdash
- librato
Splunk
- is a time-series indexer - a product that takes care of the three Vs very well.
- 3 main functionalities
- Data collection
- from static source
- from real-time source
- from log files, rolling log files
- from databases
- from script results
- Data indexing - index of above data
- Search and Analysis - Using Splunk Processing Language to search and extract results in the form of charts, events, etc.
- Data collection
- Splunk breaks down log file entries into different events based on the associated timestamp. If no timestamp is found, then all the lines in the log file is considered as a single event.
Components
- Search Head
- Forwarders
Queries
- Top browsers:
sourcetype="access_combined_wcookie" | top useragent - Bottom 3 browsers:
sourcetype=access_combined_wcookie | rare useragent limit=3 - Top 5 IP address:
sourcetype="access_combined_wcookie" | top clientip limit=5 - Top Referers without percent field:
sourcetype=access_combined_wcookie referer != *MyGizmo* | top referer | fields - percent - Count of 404 errors grouped by
source: sourcetype=access_combined_wcookie status=404 | stats count by source - Top purchases by product:
sourcetype=access* | timechart count(eval(action="purchase")) by productId usenull=f - Pages views and purchases:
sourcetype=access_* | timechart per_hour(eval(method="GET")) AS Views, per_hour(eval(action="purchase")) AS Purchases - Geo location of IPs (Google Maps):
sourcetype=access* | geoip clientip
Analytics
- also known as Business Intelligence / Data Mining / OLAP
- Traditional analytics are based on ‘Early Structure Binding’, where you need to know beforehand what questions are going to be asked of the data.
- The typical development steps can be summarized as follows:
- Decide what questions to ask
- Design the data schema
- Normalize the data
- Write database insertion code
- Create the queries
- Feed the results into an analytics tool
- The typical development steps can be summarized as follows:
- Late Structure Binding, which has these simple steps:
- Write data (or events) to log files
- Collect the log files
- Create searches, graphs, and reports using Splunk
- Operational Intelligence refers to the information collected and processed
- Semantic logging as data or events that are written to log files explicitly for the purpose of gathering analytics.
Logging
- Structured Logging - https://stackify.com/what-is-structured-logging-and-why-developers-need-it/
slf4j
- Meta logging Frameworks - http://www.slf4j.org
- NDC, MDC statements - http://stackoverflow.com/questions/7404435/conditional-logging-with-log4j?
- What are the classloader issues that plague JCL?
- what is meant by ‘static binding approach’ in sl4j?
- Marker objects
- NOPLogger?
Tracing
- Distributed Tracing is a methodology and toolchain for monitoring the complex interactions inherent in a microservice architecture.
- e.g. Google Dapper, Zipkin
- How it works?
- for every request that ocmes in, “tag” it with a unique request ID.
- this request ID stays with the request and resulting requests throughout its life, allowing to see what services a request touches and how much time is spent in each service.
- Tracing is more concerned with individual requests than aggregated metrics
OpenTracing
- OpenTracing is a vendor neutral specification for instrumentation APIs.
- It offers consistent, expressive, vendor-neutral APIs for popular platforms, making it easy for developers to add (or switch) tracing implementations with an
O(1)configuration change. - OpenTracing also offers a lingua franca for OSS instrumentation and platform-specific tracing helper libraries.
- Tutorials
- CNCF Jaeger, a Distributed Tracing UI Platform
References
- Books
- Mastering Distributed Tracing
- Distributed Systems Observability - Cindy Sridharan
- Logging and Log Management - Anton Chuvakin, Kevin Schmidt
- O’Reilly - Practical Monitoring - Mike Julian
- O’Reilly - Monitoring Distributed Systems - Rob Ewaschuk, Betsy Beyer
- O’Reilly - Site Reliability Engineering
- Circonus - The Art and Science of the Service-Level Objective - paper by Theo Schlossnagle